APEX: cis-xQTL analysis guide
This page describes benchmarking experiments with APEX for various QTL analysis tasks. This is intended to serve as a guide for time and memory usage requirements, identify and delineate numerical differences between software tools, and highlight unique features of APEX.
Table of Contents
LMM Benchmarking
We used empirical genotype data for 10,000 samples and simulated molecular phenotype data to benchmark time and memory for trans-xQTL analysis using a linear mixed model (LMM) using APEX LMM, FastGWA [1], BOLT-LMM [2], and GMMAT [3-4].
Input data
| Sample size | No. traits | No. SNPs | No. covariates |
|---|---|---|---|
| 10,000 | 16,329 | 590,606 | 10 |
Time and memory usage
| CPU hours | Time speedup | Max memory | |
|---|---|---|---|
| APEX, p < 5e-5 | 7.5 | 0.36 | 4.88 Gb |
| APEX | 20.8 | 1.00* | 4.88 Gb |
| FastGWA | 52.1 | 2.50 | 0.14 Gb |
| BOLT-LMM | 1,068.9 | 51.39 | 0.67 Gb |
| GMMAT | ~5,692.5 | ~273.68 | N/A |
Software commands
Commands used in LMM benchmarking analysis are given below:
APEX command:
- parallel over chromosomes, all traits at once
- sparse GRM
- compressed BCF format genotype data
apex trans --bed $all_traits_bed --bcf $bcf --cov $covar_txt --grm $grm --region ${chr} --out trans_chr${chr}BOLT-LMM command:
- parallel over traits, all chroms at once
- 172,045 LD-pruned SNPs (no sparse GRM)
- uncompressed BED/BIM/FAM format genotype data
bolt --lmm --LDscoresFile=$ldsc_f --bfile=$bfile --phenoFile=trait_${trait}.ped --phenoCol=${trait} --qCovarCol=PC{1:10} --covarFile=$covar_ped --modelSnps=${snp_file} --statsFile=bolt_${trait}fastGWA command:
- parallel over traits, all chroms at once
- Sparse GRM
- uncompressed BED/BIM/FAM format genotype data
gcta64 --fastGWA-mlm --bfile $bfile --grm-sparse $sgrm --pheno trait_${trait}.ped --qcovar $covar_ped --threads 1 --out gcta_${trait}GMMAT command:
- parallel over traits, parallel over chroms
- Sparse GRM
- Compressed GDS format genotype data
eqn <- as.formula( Y ~ PC1 + PC2 + PC3 + PC4 + PC5 + PC6 + PC7 + PC8 + PC9 + PC10)
null_fit <- GMMAT::glmmkin(
 eqn, data = trait_data, id = "id",
 kins = GRM, family = gaussian(),
 method = "REML", method.optim = "AI", verbose = TRUE
)
GMMAT::glmm.score(obj = null_fit, infile = gds_file, outfile = trait_out_file, verbose = TRUE)
Software concordance:
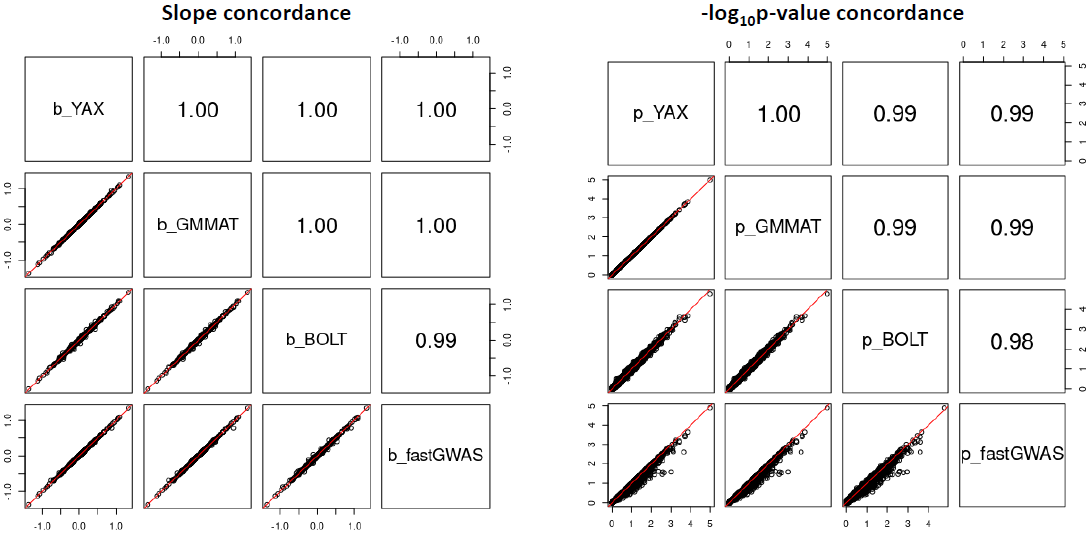
LMM association tests from APEX and GMMAT are nearly numerically equivalent, as expected. BOLT-LMM uses the conjugate gradient method to avoid storing an explicit GRM, and a retrospective quasi-likelihood score test; these differences may explain differences with APEX and GMMAT. FastGWA uses the GRAMMAR-Gamma approximation to calculate association tests, which may explain differences with APEX and GMMAT. Results are shown for 1 gene on chromosome 1, and are reflective of overall trends.
cis-eQTL Benchmarking
We compared cis-eQTL analysis using APEX, FastQTL [5], and QTLtools [6] in the Geuvadis LCL eQTL data set [7-8] (454 samples, 17815 genes, and 70 covariates including PEER factors [12]). Single-variant association slopes and p-values are equivalent between FastQTL and APEX (not shown). QTLtools fits simple linear regressions between trait residuals and genotypes (lm(y_resid ~ geno)) rather than using multiple regression t-tests (lm(y ~ geno + covariates)), and therefore its p-values are slightly conservative.
APEX calculates gene-level cis-eQTL p-values accounting for LD using ACAT [11], which aggregates all single-variant p-values across the cis region. FastQTL and QTLtools calculate gene-level cis-eQTL p-values accounting for LD by modeling the null distribution of the minimum single-variant p-value as a beta density, with beta parameters estimated by permutation. In the examples below, results using the two methods are highly similar, but ACAT is ~30x faster. In simulation studies, both type I error rates from both methods (ACAT and permutation-based beta approximation) are well-calibrated.
Results
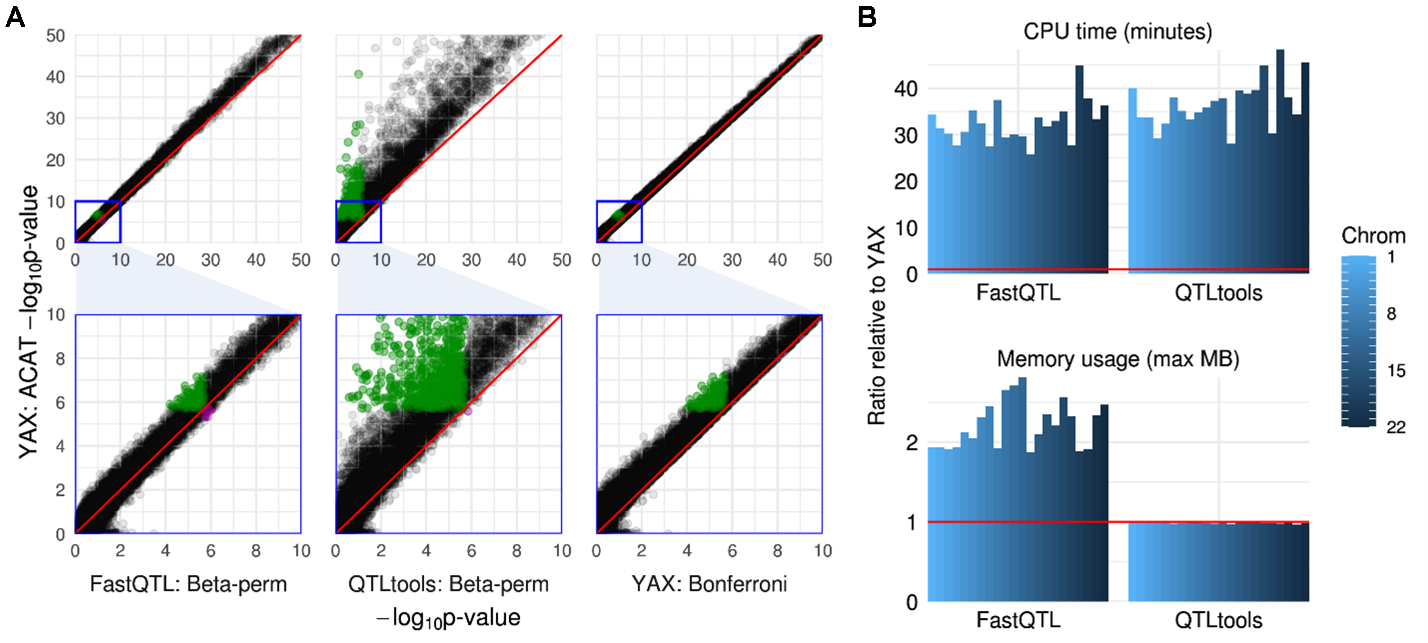
A: Gene-level cis-eQTL p-values in the Geuvadis LCL dataset. Associations detected only by ACAT are marked in green in each column; associations detected only by FastQTL, QTLtools, or Bonferroni (but not ACAT) are marked in magenta.
B: Comparison of time and memory usage for FastQTL and QTLtools. FastQTL was run using the adaptive p-value setting with 100 to 1000 permutations; QTLtools was run using 1000 permutations; APEX uses ACAT to account for LD rather than permutations. For each software, autosomal cis-eQTL analysis was run in parallel with 1 CPU per chromosome.
Meta-analysis
Multiple-variant meta-analysis in APEX requires sumstat files (generated by ./apex cis), which store SNP-trait association data, and vcov files (./apex store), which store covariate-adjusted linkage disequilibrium (LD) data.
We compared sumstat and vcov file storage sizes across 3 QTL studies:
Data sets
| GTEx LCLs [9] | Geuvadis [7-8] | HapMap [10] | |
|---|---|---|---|
| Variants | 10,932,660 | 10,945,700 | 10,943,352 |
| Sample size | 147 | 454 | 518 |
| Covariates | 23 | 70 | 97 |
| Genes | 22,759 | 17,815 | 16,329 |
Storage size
| GTEx v8 LCLs | Geuvadis | HapMap | |
|---|---|---|---|
| vcov file size (2MB window) | 19.45 Gb | 30.38 Gb | 36.16 Gb |
| vcov index size | 0.56 Gb | 1.61 Gb | 2.67 Gb |
| cis sumstats size | 0.45 Gb | 0.39 Gb | 0.43 Gb |
References
- Jiang, Longda, et al. A resource-efficient tool for mixed model association analysis of large-scale data. Nature Publishing Group, 2019. fastGWA software.
- Loh, Po-Ru, et al. “Efficient Bayesian mixed-model analysis increases association power in large cohorts.” Nature genetics 47.3 (2015): 284. BOLT-LMM software.
- Chen, Han, et al. “Control for population structure and relatedness for binary traits in genetic association studies via logistic mixed models.” The American Journal of Human Genetics 98.4 (2016): 653-666. GMMAT software.
- Chen, Han, Matthew P. Conomos, and Duy T. Pham. “GMMAT-package: Generalized Linear Mixed Model Association Tests.” (2020).
- Ongen, Halit, et al. “Fast and efficient QTL mapper for thousands of molecular phenotypes.” Bioinformatics 32.10 (2016): 1479-1485. FastQTL software.
- Delaneau, Olivier, et al. “A complete tool set for molecular QTL discovery and analysis.” Nature communications 8.1 (2017): 1-7. QTLtools software.
- Lappalainen, Tuuli, et al. “Transcriptome and genome sequencing uncovers functional variation in humans.” Nature 501.7468 (2013): 506-511.
- 1000 Genomes Project Consortium. “An integrated map of genetic variation from 1,092 human genomes.” Nature 491.7422 (2012): 56-65.
- GTEx Consortium. “The GTEx Consortium atlas of genetic regulatory effects across human tissues.” Science 369.6509 (2020): 1318-1330.
- Bell, Jordana T., et al. “DNA methylation patterns associate with genetic and gene expression variation in HapMap cell lines.” Genome biology 12.1 (2011): R10.
- Liu, Yaowu, et al. “Acat: A fast and powerful p value combination method for rare-variant analysis in sequencing studies.” The American Journal of Human Genetics 104.3 (2019): 410-421.
- Stegle, Oliver, et al. “Using probabilistic estimation of expression residuals (PEER) to obtain increased power and interpretability of gene expression analyses.” Nature protocols 7.3 (2012): 500.